Project 1
5C COVID Dashboard
A dashboard for COVID testing data that faculty relied on, that exposed official over-counting and that was awarded Best COVID Coverage of 2021 by the CA College Media Assoc.
The Claremont Colleges' 9,000 students and 3,600 faculty and staff are split between seven undergraduate and graduate schools. Each school reported COVID testing data in a different way and place.
In September 2021, I developed the 5C COVID dashboard, a single interface collecting up-to-date information from the five undergraduate Claremont Colleges, as well as historical data going back to October 2020.
Initially created for students, soon faculty and staff told us that they relied on the dashboard to make decisions about COVID policy for their classes.
When I noticed inconsistencies in published COVID data, I developed a tool to take a screenshot of every school dashboard every day. The tool exposed multiple over-counting errors and led to a statement and correction from administrators.
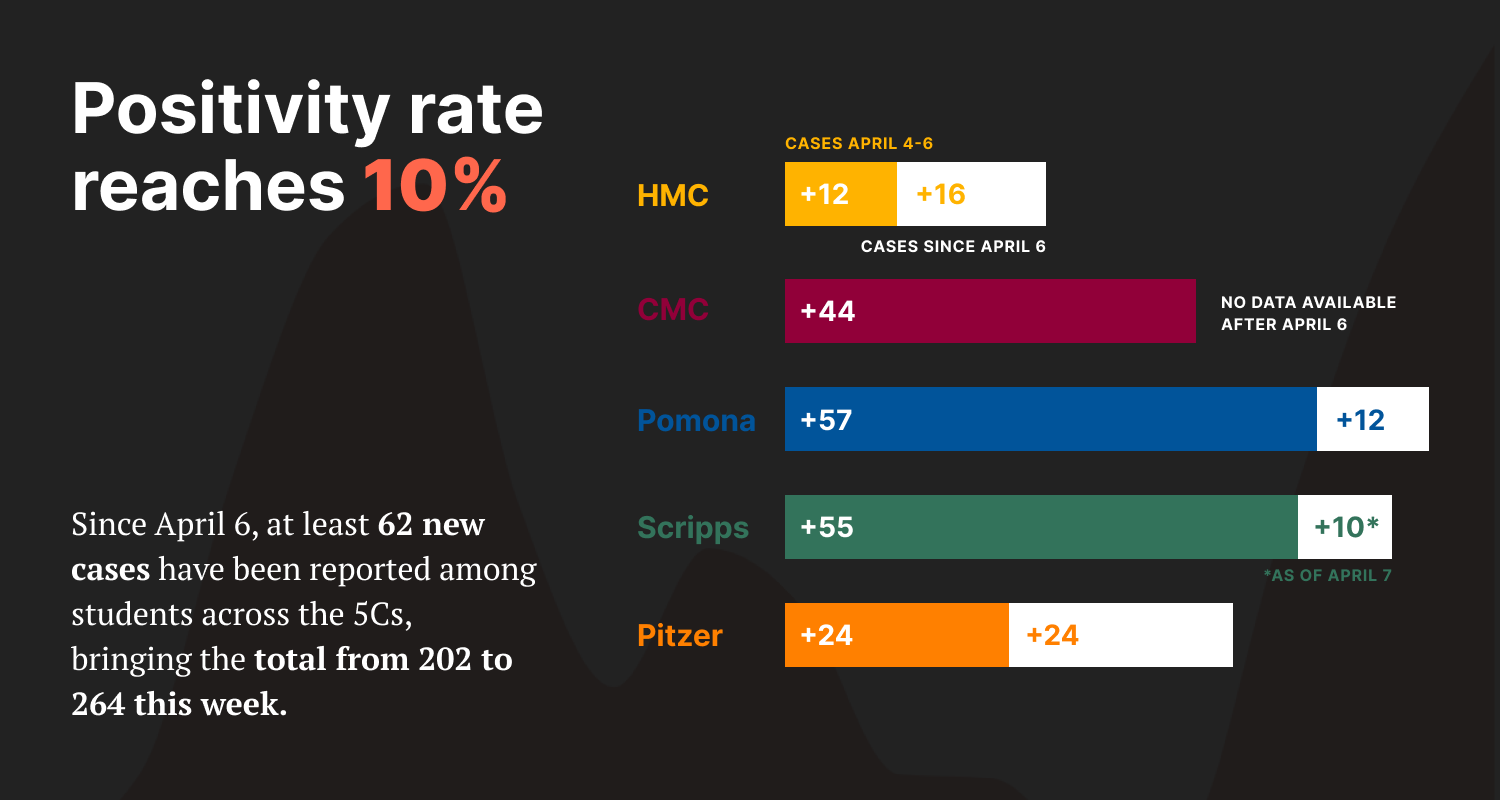
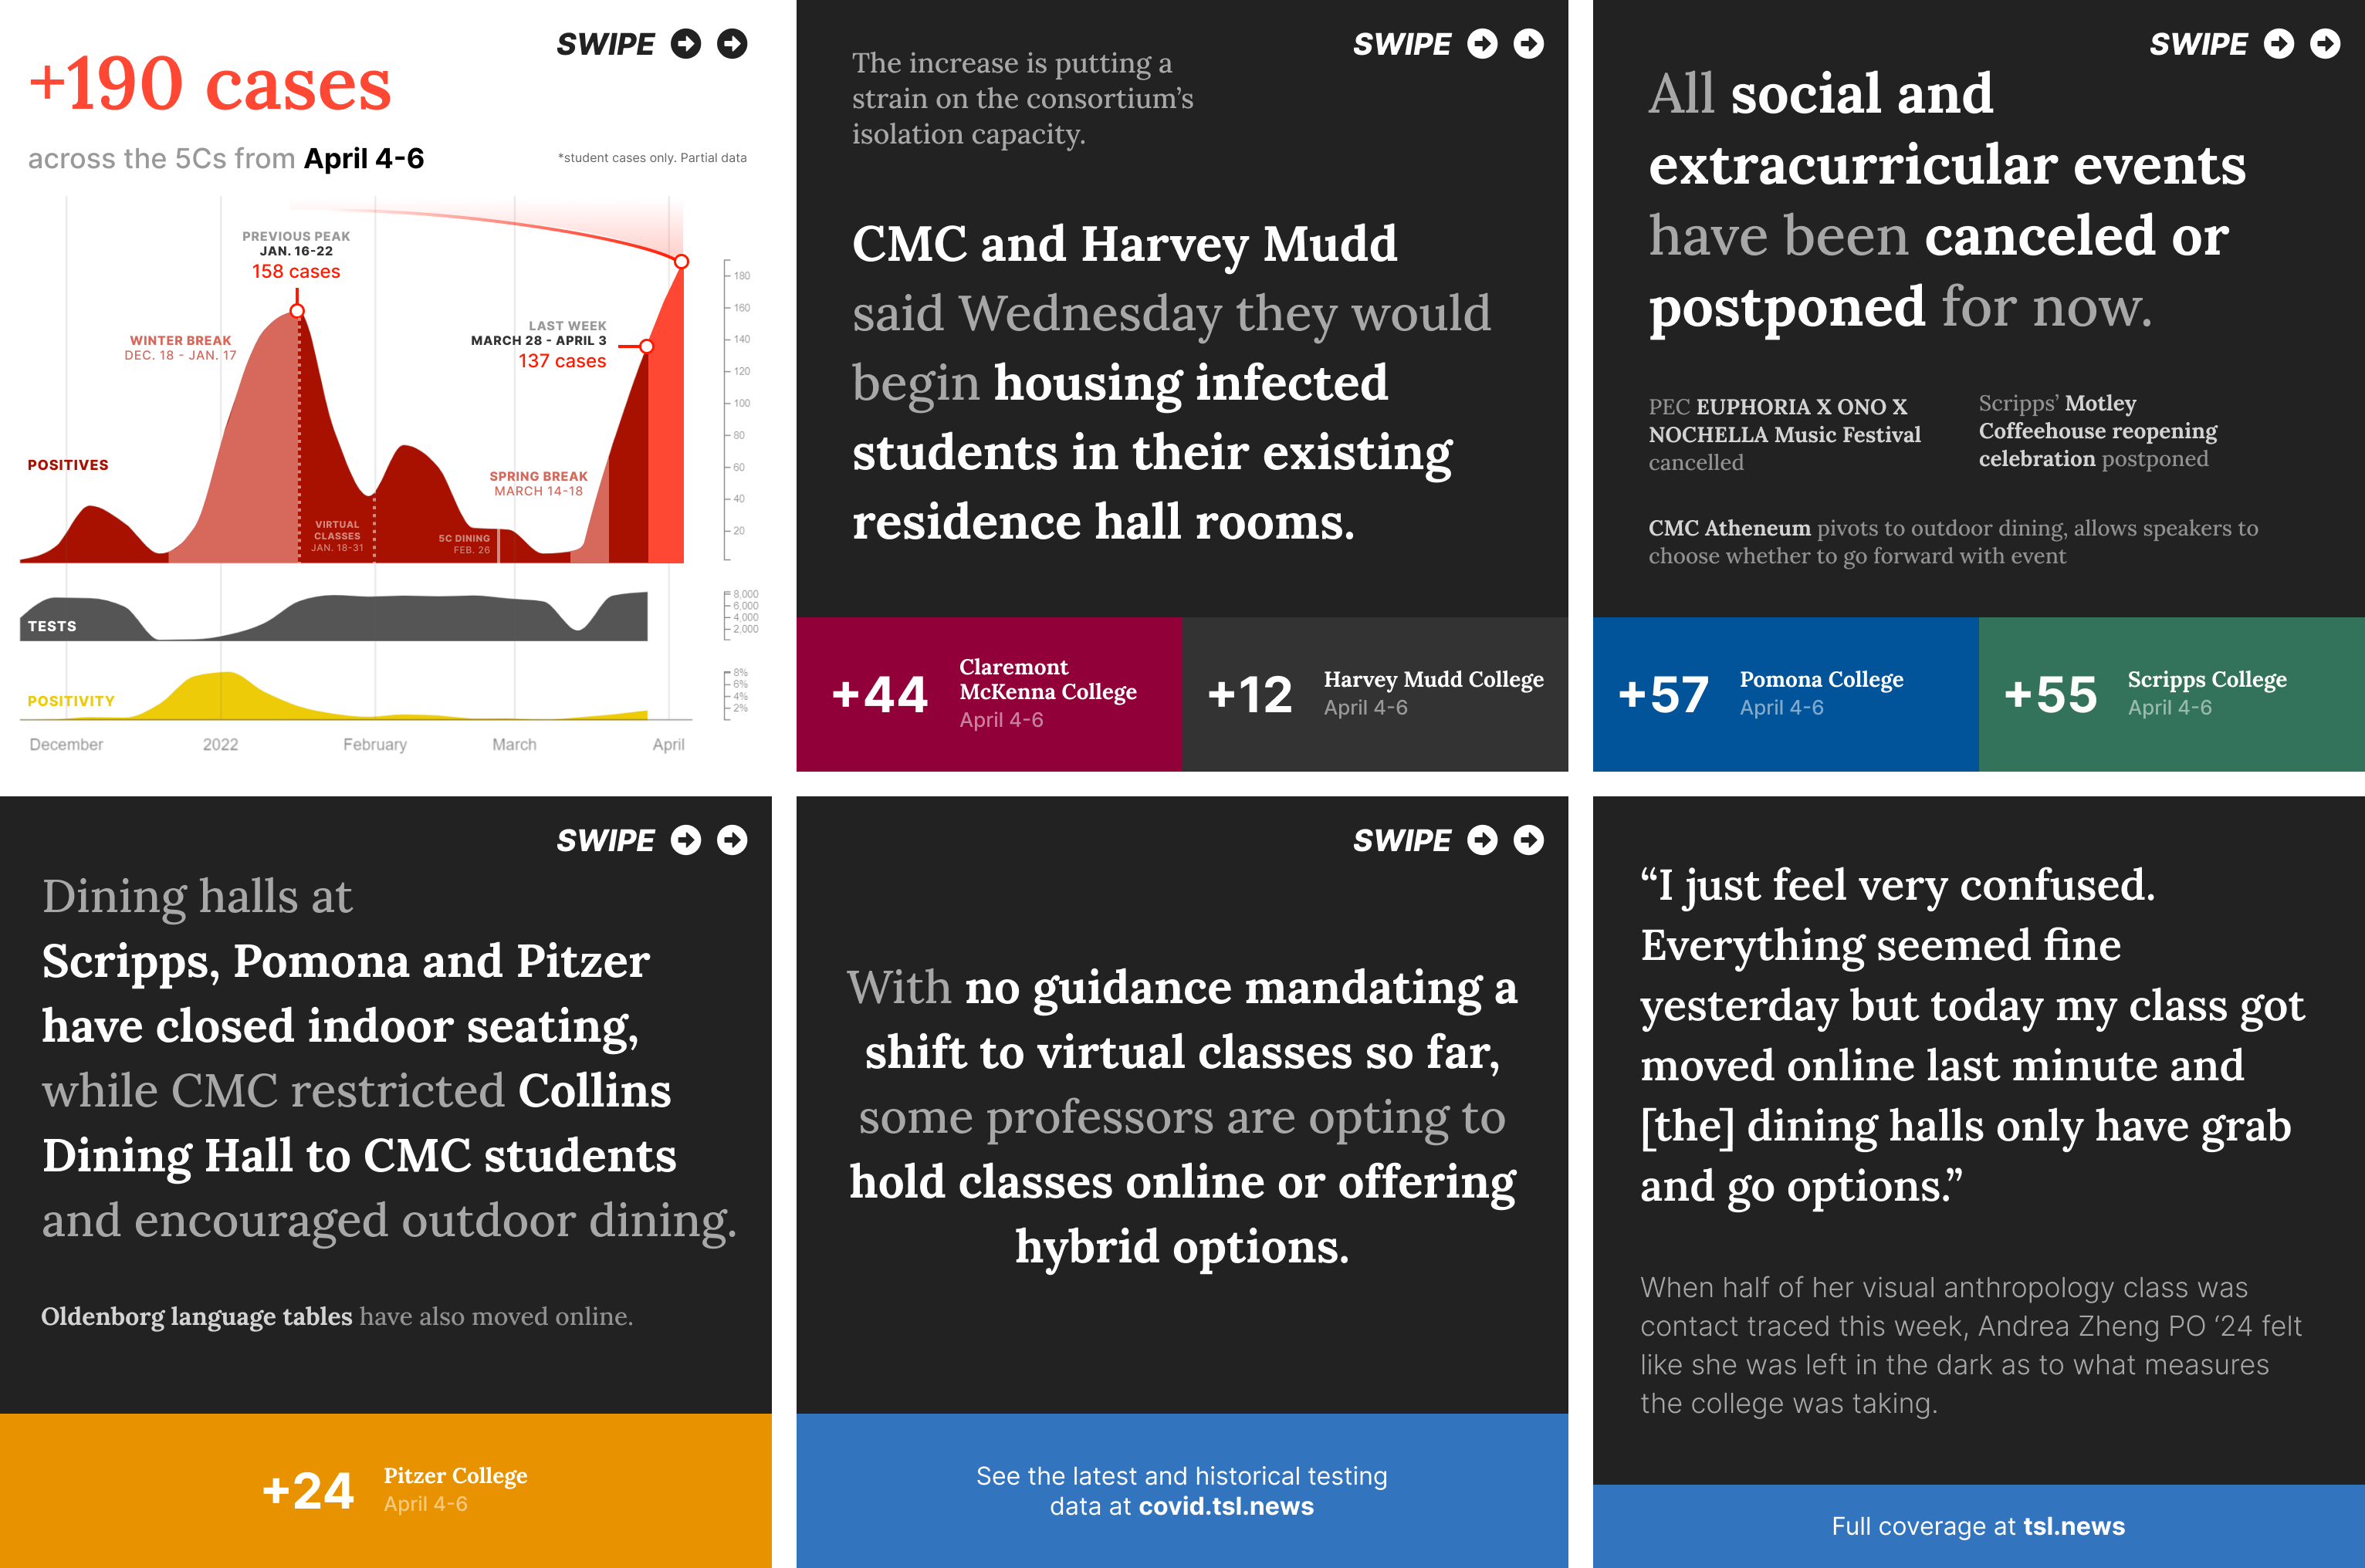
The dashboard also informed our coverage of campus COVID surges and policy changes. It was part of a package that was awarded Best COVID Coverage of 2021 by the California College Media Association.
In Fall 2022 the Claremont Colleges stopped publicly reporting COVID data completely, leaving this dashboard as the only publicly accessible archive of case counts over the last two years.
 Back homeNext: The Cost of Increasing Costs
You've read 0 of 4 scenarios.
Click through all four stories below to unlock my final message.